

Last Week Was A Case Of “e Choke”, How About This Week?


I told you to watch this space right? Well, I have something new for you yet again. This time, it’s the end of the second week and trust me, this week had us all speechless. By this time last week, we had something we were so confident in but of course, who said we ain’t confident on this one? Don’t forget, we always overcome at the end. So, while some persons were all hyped about the tasks, there were some of us who needed just a minute to catch some breaths but you can always trust Mr. Drey. He has a way of doing his things in his own time. Mr. Drey threw this one at us this time even before we could blink. I would say he used a Silencer this time, yes, I’d call it a silencer because we never saw it coming, however it riled up all our nerves.
What are we supposed to do this time?
We have different kinds of infectious and viral diseases to work on.
What are the goals?
We want to build dashboards where we interpret the datasets for these diseases in terms of; the recorded cases, the recorded deaths, total deaths/death rate, the ages and genders affected, the population affected, as well as the affected location heat maps.
What did this ever look like?
Trust me, you don’t want to know how insane sourcing for these datasets almost drove us. Well, so you know, data sourcing isn’t for the weak and yes, there are a lot of datasets out there but all has got incomplete information as regards the insights we need to interpret.
How did you overcome this struggle?
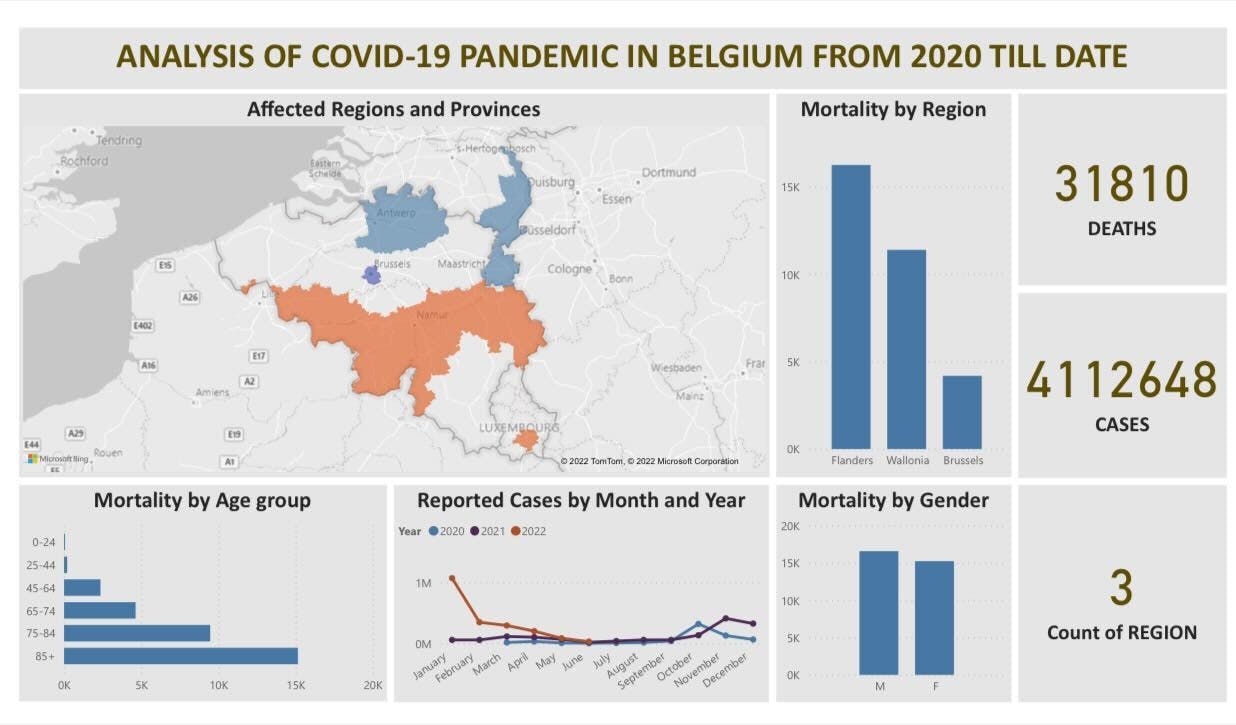
Coming across so many COVID-19 Pandemic datasets on different websites, despite having few variables missing, we worked on the BELGIUM COVID-19 DATASET FROM 2020-TILL DATE, yes you heard right. We did it web-based this time by importing our data from epistat.wiv-isp.be/covid. With this dataset, we analyzed and interpreted the information collected on the dashboard. You just have to click on the PBix file link below to catch this LIVE.
What else did you achieve?
Oh! you ain’t aware we were tasked to choose two datasets to work with? Haha. I don’t know about other teams but my teammates and I considered this ‘WAR’. We also searched for the other diseases listed ranging from HIV/AIDS, Lassa Fever, Hepatitis, Cholera, to Malaria. We already gave up on this because the information weren’t giving considering the variables we really need for the task. We just almost accepted defeat on this one.
So…?
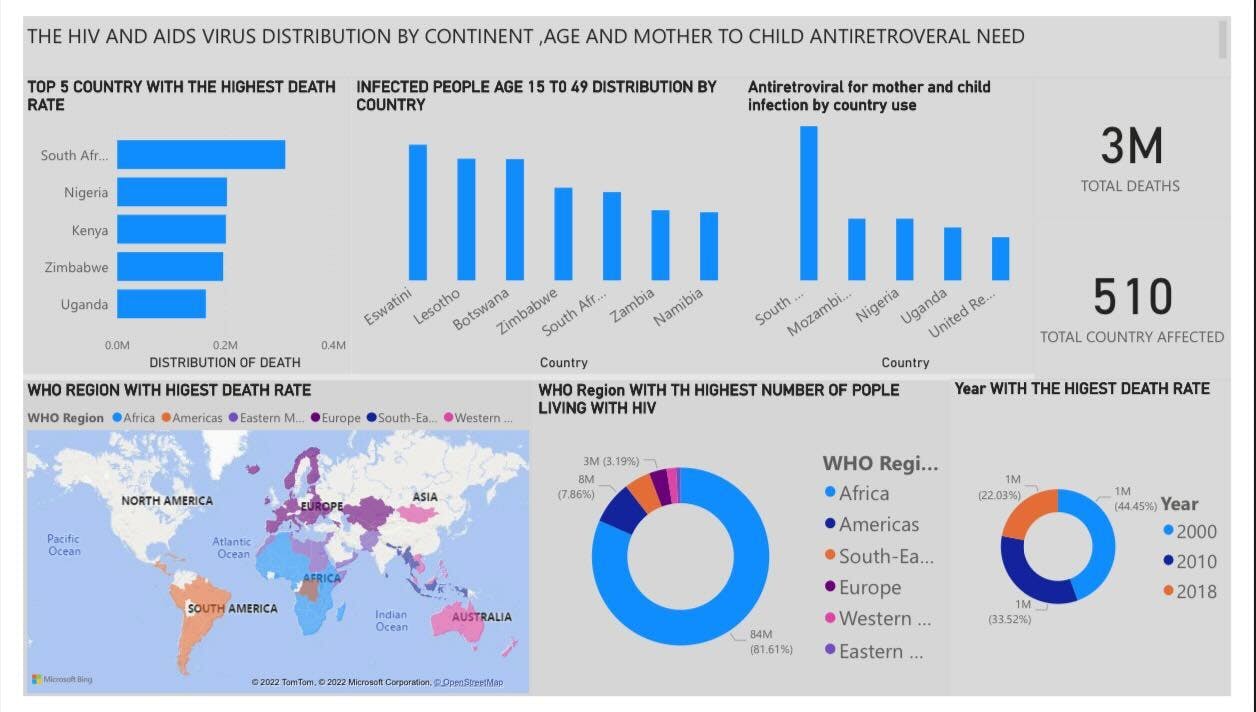
Exactly 6:06pm, Oluchi shocked the team with a dashboard comprising the analysis of the HIV/AIDS DISTRIBUTION BY CONTINENT, AGE AND MOTHER-TO-CHILD ANTIRETROVIRAL NEED gotten from kaggle.com/imdevskp/hiv-aids-dataset. With this dataset, the mortality rate, affected population, the WHO regions affected…, slow down and check out the Pbix file link for a complete view of this live data.
What else do you want us to know?
Oh! Well, this week has been hectic, more tasking and almost close to terrible but you know our slogan, right? WE ARE ALL WINNERS! I’m glad we got your attention, stay glued for next week and don’t forget to check out our live dashboards via the links.
Covid Dashboard Image
HIV/AIDS Dashboard Image
Link to power bi files: drive.google.com/drive/folders/1O-FDIfscGdc..