

“ Every Takeoff Is Optional; Every Landing Is Mandatory ”


The visualization below shows the analysis of the Operational Performance of the Austin-Bergstrom International Airport, Austin, Texas, USA, from 2012 to 2014.
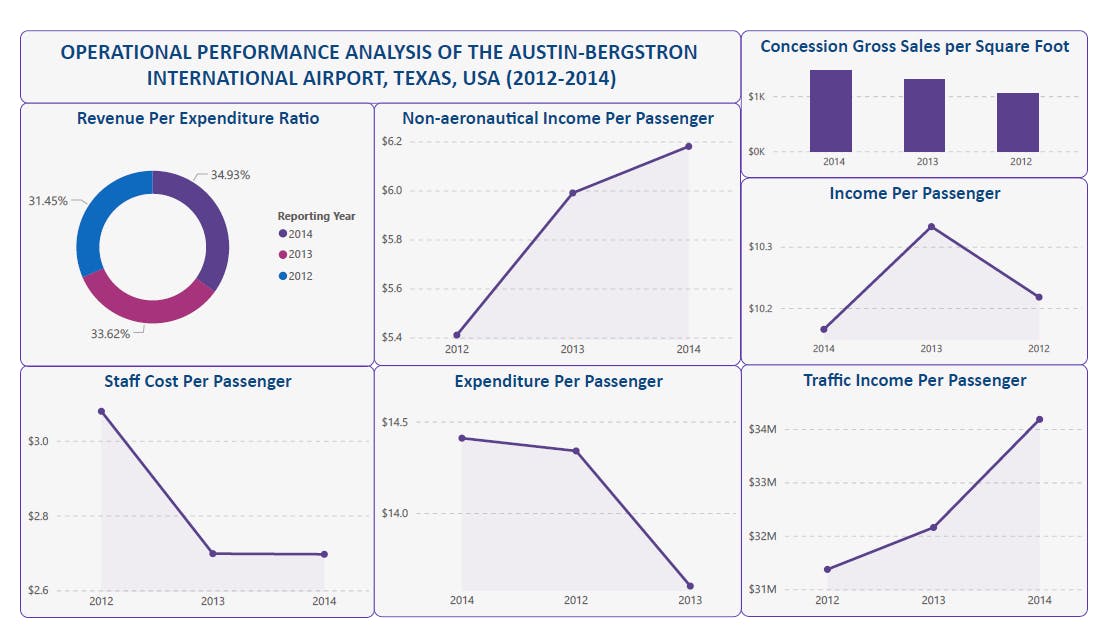
The analysis shows the Revenue Per Expenditure ratio which was calculated as the airport's total annual operational income divided by the expenses (costs) incurred during the years. These expenses include; Aircraft Rescue and Fire Fighting (ARFF) cost, repair and maintenance cost, security cost, personnel (staff) expenses, etc. However, the highest Income (revenue) per Expenditure was recorded in 2014 with a standing amount of $2.2, as well as the lowest income of $1.9 realized in 2012.
The Income Per Passenger shows the total annual operational revenue divided by the annual number of passengers recorded, which could be in terms of sum of fee generated during passenger’s arrival, departure or transfer. The highest airport revenue per passenger realized was recorded in 2013 and the lowest in 2014 with amounts of $10.3 and $10.2 respectively.
The non-aeronautical revenue also known as the non-airline revenue, is generated in terms of car parking, space leasing, etc. This analysis shows the highest non-airline income of $6.18 recorded in 2014.
The Staff Cost Per Passenger was analyzed in terms of the personnel (staff) expenses incurred divided by the annual number of passengers with the highest ($3.1) and lowest ($2.7) expenditure recorded in 2012 and 2014 respectively.
The Traffic Income Per Passenger is generated in terms of non-airline activities such as parking and ground transportation. However, the airport recorded the highest income of $34 million in 2014.
The highest and lowest passenger expenses (Expenditure Per Passenger) was recorded in 2014 and 2013 with incurred expenses of $14.4 and $13.6 respectively.
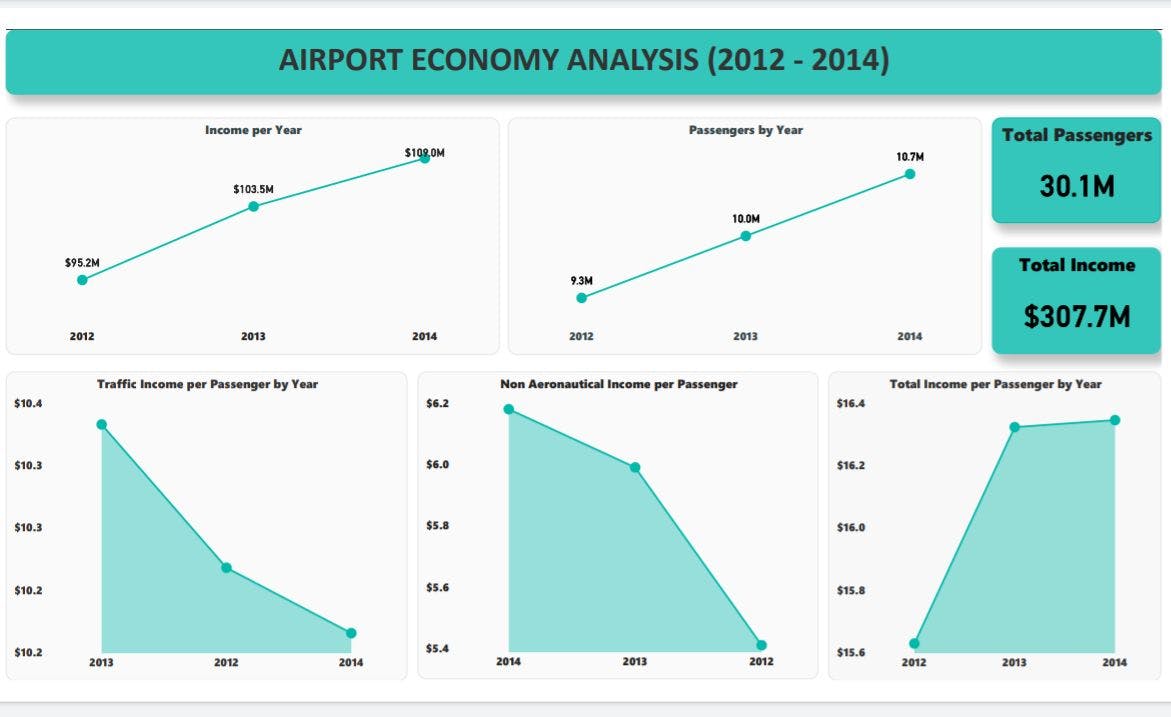
The Austin-Bergstrom International Airport recorded a total operational revenue of $307.7 million between 2012 to 2014. A total of 30.1 million passengers was recorded during these years.
Attached below is the link to the PBix files showing the analyzed dataset and corresponding dashboards.
Link to google drive: drive.google.com/drive/folders/1ttf9RNHdRGH..